Chemical Composition
Chemical composition and identification of the Mount Vision Granite from locally found samples.


Glazes are formulated by mixing oxides that contain silica, the main glass former, fluxes that include sodium, potassium, calcium and a few other elements, which reduce the melting temperature of the silica, and alumina which provides stability, keeping the glaze from running off the pot.
Knowing, at least approximately, the proportions of these elements in our glaze materials is necessary to formulate a functional glaze, one that melts in our kilns and possesses the characteristics we seek, be it glossy or matte, transparent or opaque, and so forth.
With this in mind, this article presents the chemical analysis and identification of the granite found in my yard, which lies adjacent to Mount Vision.
Samples of Mount Vision Granite
The pictures below show samples of two types of granite found on the property. The "dark" sample (left), same as shown at the top of this article, is more commonly found. But there is enough of the "light" sample (right) available to be intrigued by it.
Visually they look different. The "dark" sample has more mica, mostly biotite, which is black, and gives the rock a salt-and-pepper look. Both samples have visible quartz and feldspar crystals, with the "light" sample having more and larger quartz and feldspar crystals, and having much less mica.
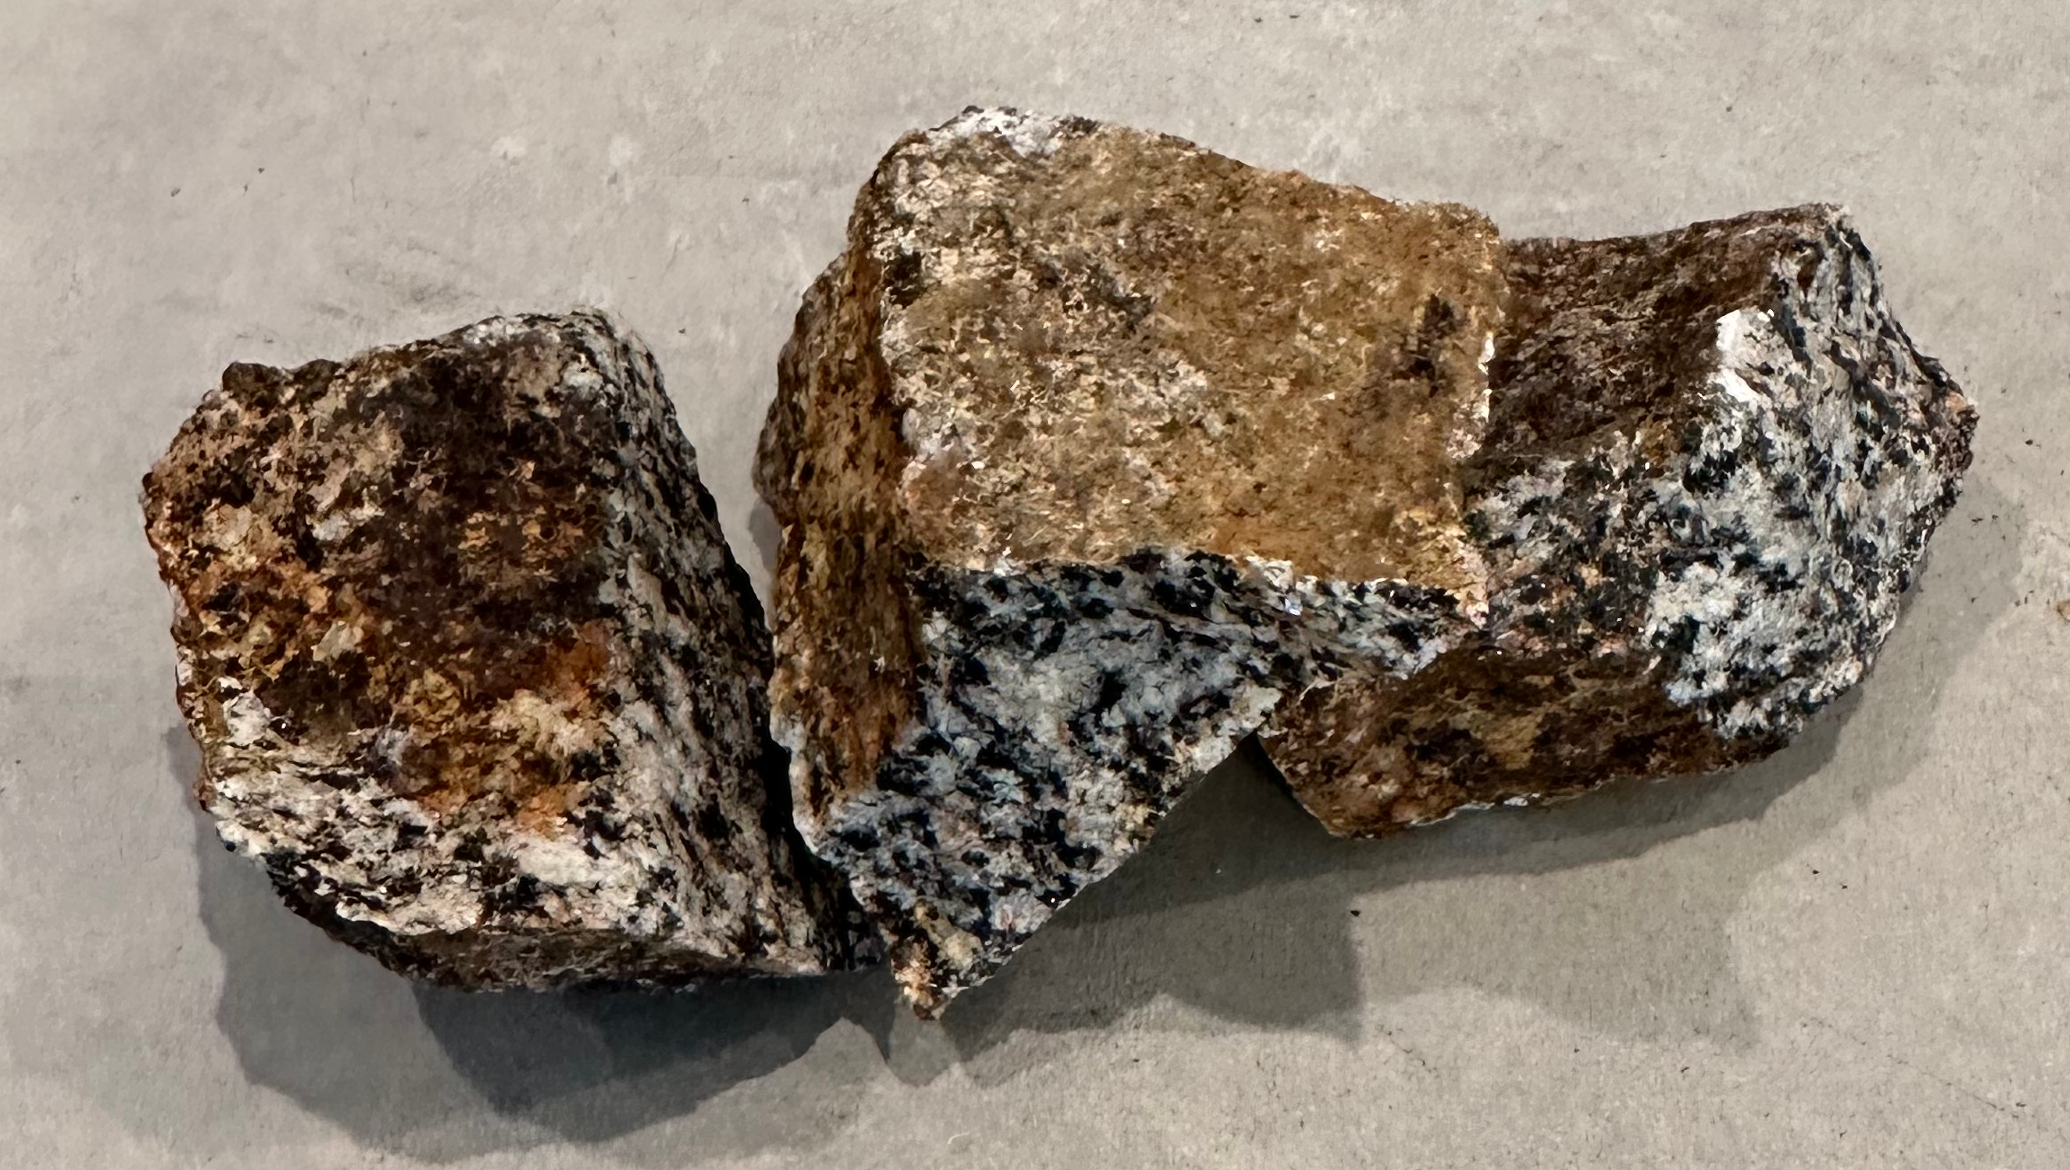
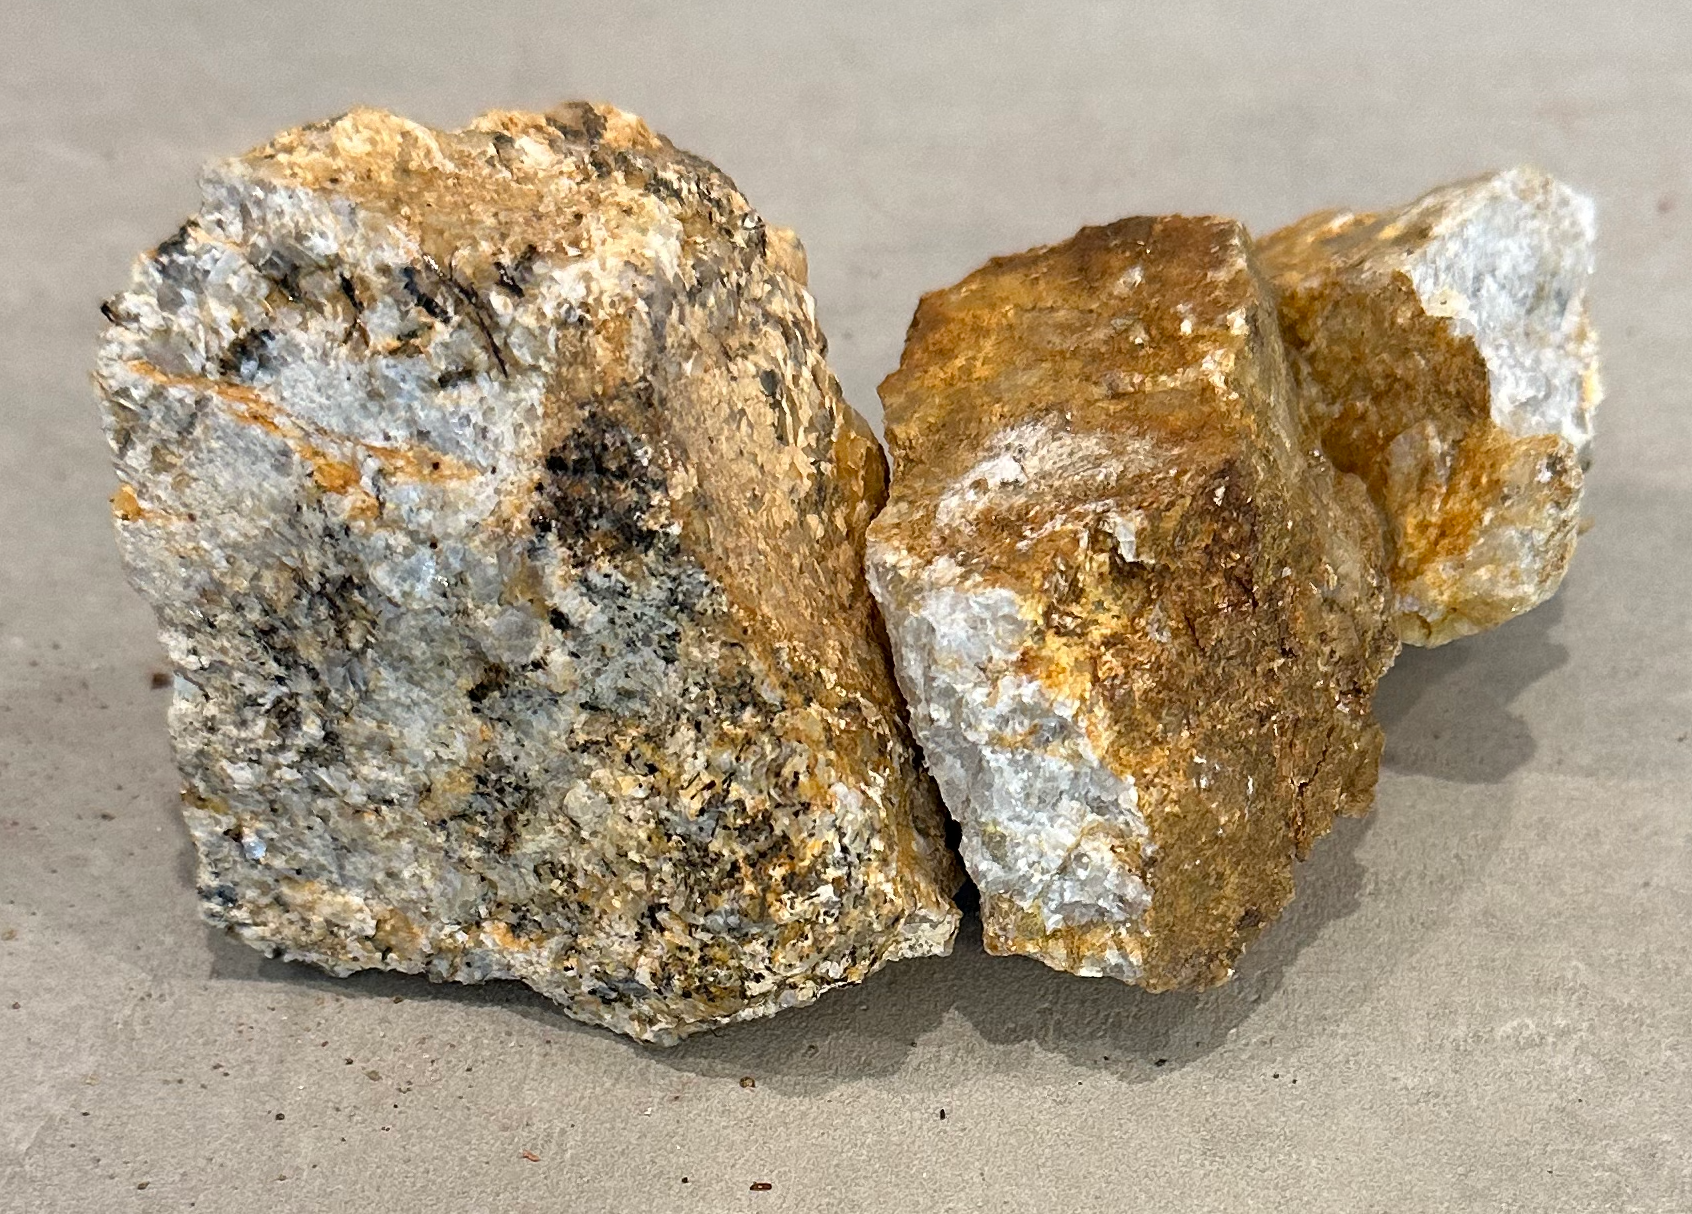
Dark Sample (left) and Light Sample (right)
An analysis to estimate the ratio of one to the other on the property has yet to be performed except to confirm the dark sample appears by far to be the most prevalent.
At this point we wish to know what the granite is chemically comprised of so we can make a glaze from it.
The Chemical Composition of the Mount Vision Granite
Granite is coarse-grained, hard, and tough. It is composed mostly of quartz and feldspars in varying proportions.
Geologists classify plutonic rocks by their relative percentages of quartz, alkali feldspar (orthoclase) and plagioclase feldspar in a diagram aptly named the "Quartz, Alkali Feldspar, Plagioclase, Feldspathoid" (QAPF), created by the International Union of the Geological Sciences in 1972.
The QAPF diagram is shown below. We are interested in the "granitic" rock mapped in upper triangle between Q-A-P.
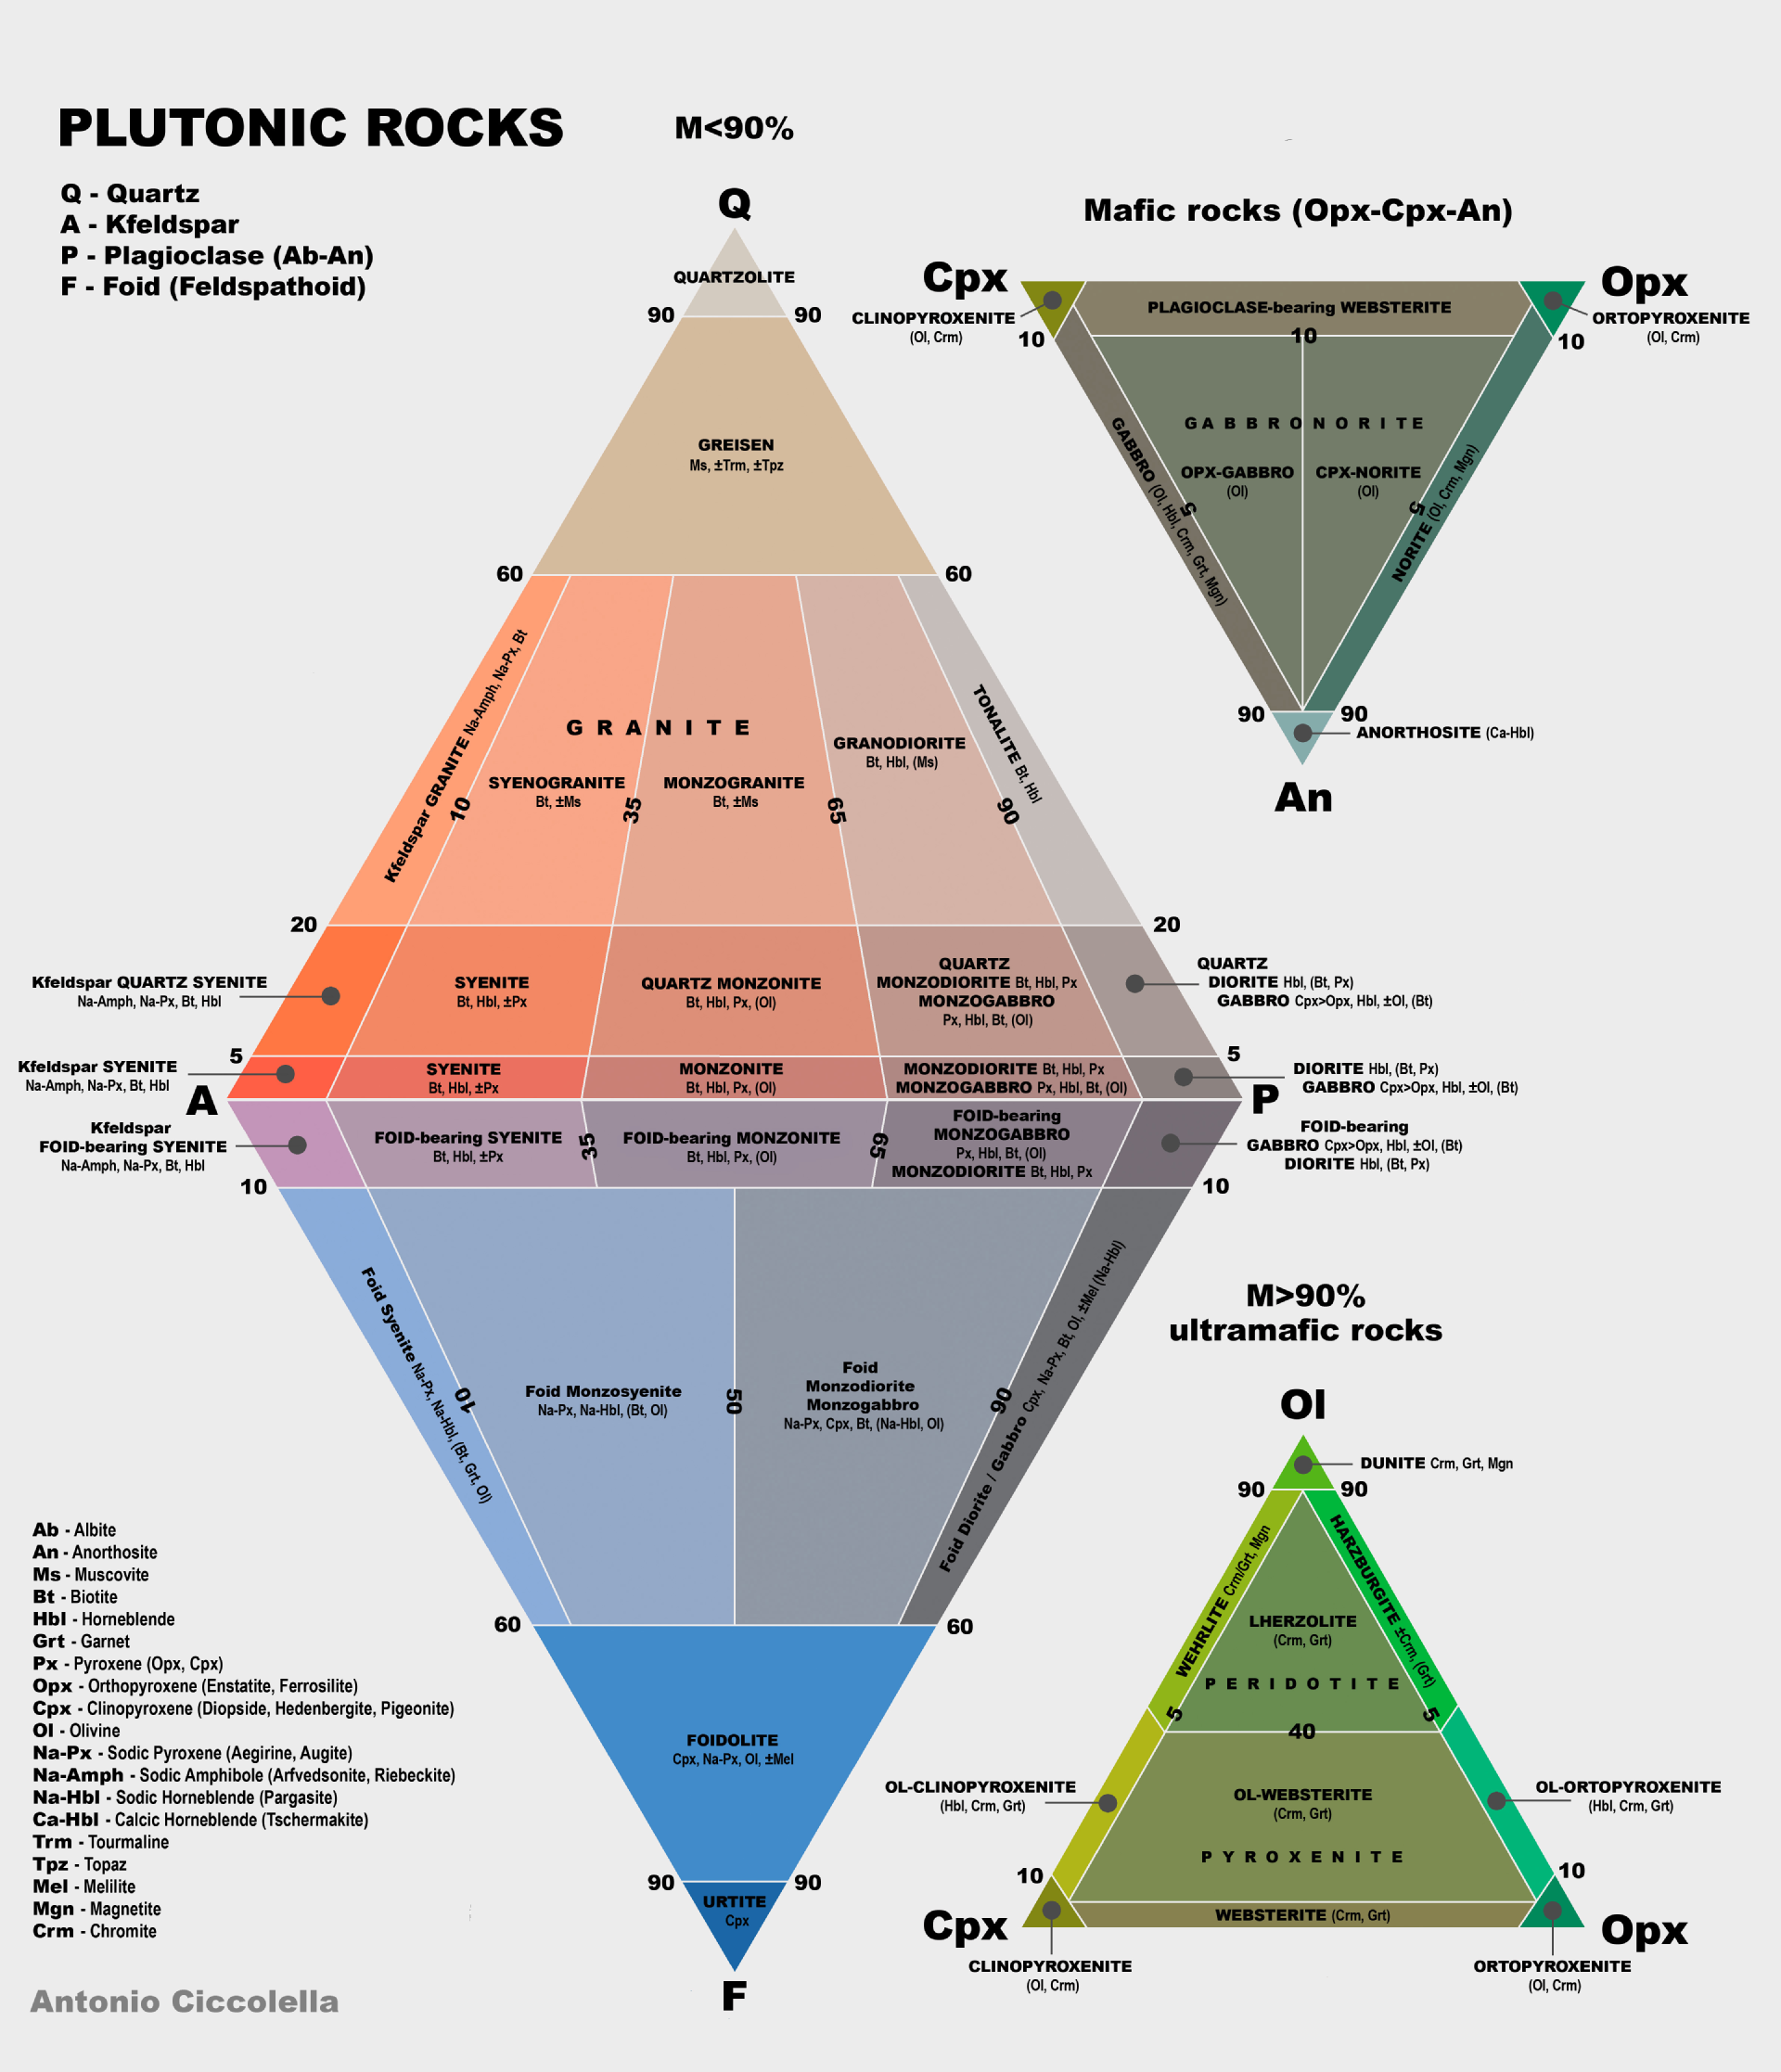
We can locate the Point Reyes peninsula granites mentioned here on the QAPF. Granite "proper", Granodiorite and Tonalite span most of the 20% - 60% quartz (Q) range and, moving left to right, differ in their proportions of Alkali Feldspars (A) and Plagioclase (P). Quartz Diorite can be found beneath Tonalite in the 5% - 20% Q range with high concentrations of P.
Note Granite "proper" takes up just a portion of the QAP triangle, thus the source of confusion when simultaneously all the rocks within the triangle are referred to, as a unit, as "granite".
Why is the QAPF of interest? Silica, the main glass former, comes from quartz (Q), important fluxes like sodium come from alkali feldspars (A) and potassium and calcium from plagioclase (P). The literature reports Mt Vision is predominantly granodiorite, so the QAPF gives a range of the chemical make up of the samples in these terms.
While the QAPF diagram is informative and helpful to start formulating a glaze from the granite, it is coarse information. As noted above, according to the QAPF, Granodiorite can vary between 20% and 60% in quartz (silica), 65% - 90% plagioclase (sodium and calcium) and 10% - 35% alkali feldspar (potassium). Such a range is indicative of the variation these types of rocks exhibit in nature and implies a wide set of tests might be necessary to develop a proper glaze.
Fortunately one can know more. Both samples were analyzed for their chemical makeup by the Geo Lab at Washington State University. Their services are easy to arrange and are reasonably inexpensive.
The table below presents the normalized percentage distribution of oxides by weight measured by the lab for the "light" and "dark" samples.
| Oxide | Dark Sample | USGS (GD) | Le Maitre (GD) | Light Sample | Jackson (G) | Le Maitre (G) |
|---|---|---|---|---|---|---|
| SiO2 | 68.43 | 67.88 | 66.09 | 77.54 | 75.64 | 71.30 |
| TiO2 | 0.52 | 0.67 | 0.54 | 0.01 | 0.20 | 0.31 |
| Al2O3 | 15.63 | 15.19 | 15.73 | 13.33 | 13.37 | 14.32 |
| FeO | 4.22 | 4.49 | 5.0 | 0.63 | 1.34 | 2.85 |
| MnO | 0.07 | 0.04 | 0.08 | 0.10 | 0.03 | 0.05 |
| MgO | 0.80 | 0.98 | 1.74 | 0.01 | 0.38 | 0.71 |
| CaO | 2.76 | 2.14 | 3.83 | 0.58 | 1.38 | 1.84 |
| Na2O | 3.79 | 2.83 | 3.75 | 3.48 | 3.23 | 3.68 |
| K2O | 3.63 | 5.48 | 2.73 | 4.29 | 4.37 | 4.07 |
| P2O5 | 0.15 | 0.30 | 0.18 | 0.03 | 0.06 | 0.12 |
| Total | 100.0 | 100.0 | 98.73 | 100.0 | 100.0 | 99.25 |
The percentage distribution of oxides by weight contained in the granitic samples along with reference examples where G = Granite "proper", GD = Granodiorite
Included as reference samples are:
- A USGS published reference granodiorite (GD) from Silver Plume, Colorado that was provided by the WS Geo Lab.
- An analysis of granite (G) from Devil's Playground, Utah, published by Hamish Jackson that was also produced by the WS Geo Lab.
- An averaged composition of granodiorite (GD) from 885 analyses (Le Maitre, 1975)
- An averaged composition of granite (G) from 2485 analyses (Le Maitre, 1975)
One might correctly observe there is not a huge difference overall in the data. Being "granite", all examples are dominant in silica (SiO2), followed by alumina (Al2O3), then sodium (Na2O), potassium (K2O) and calcium (CaO). Iron (FeO) appears in greater amount in the granodiorite examples than the granite examples. Traces of titanium (TiO2), manganese (MnO), magnesium (MgO) and phosphorus (P2O5) exist in all.
This said, we now have good data. By knowing the distribution of oxides contained in the "dark" and "light" samples we can start using glaze formulation tools such as those found at glazy.org to help develop a glaze using the granite.
But what type of granite are the "dark" and "light" samples?
Let's continue by asking the question "what type of granite are the two samples"?
Looking a bit more closely at the data above we can observe the "dark" sample aligns with the granodiorite (GD) reference samples and the "light" sample aligns with the granite "proper" (G) reference samples.
The silica content is much greater than 60% in all the oxide examples, so how does this data relate back to the QAPF diagram? Remember the vertical axis of the QAPF diagram is quartz content, which is a mineral made of silica. But the other minerals in the granite, namely the alkali feldspars (orthoclase), plagioclase and the micas, biotite, muscovite, hornblend, etc., also contain silica. So the total silica measured in the rock samples will be greater than the total silica contained in the quartz.
Fortunately we can perform a cross check with the QAPF by calculating what's named the CIWP Norm, which recasts the chemical analyses above into a set of hypothetical igneous minerals.
The results are given in the table below.
| Dark Sample | USGS (GD) | Le Maitre (GD) | Light Sample | Jackson (G) | Le Maitre (G) | |
|---|---|---|---|---|---|---|
| Quartz | 26% | 25% | 22% | 40% | 36% | 29% |
| Alkali Feldspar (AF) | 21% | 32% | 16% | 25% | 26% | 24% |
| Plagioclase (P) | 45% | 32% | 50% | 32% | 34% | 40% |
| P/(P+AF) | 68% | 50% | 75% | 56% | 57% | 63% |
| QAPF Mapping | Granodiorite | Granite | Granodiorite | Granite | Granite | Granite |
We see the "dark" sample maps to granodiorite and the "light" sample maps to granite. All the reference samples support these CIWP Norm / QAPF mappings except the USGS granodiorite which unexpectedly maps to granite instead of its published granodiorite. Why, I don't know. Most likely it is due to the CIWP Norm mapping to hypothetical sets of minerals and it misses in this case. I will report back if and when I figure it out.
Continuing, using glazy.org, we can plot all the chemical analyses together in terms of their silica (SiO2) versus alumina (Al2O2) content, according to the Seger Unity formula, as shown below.
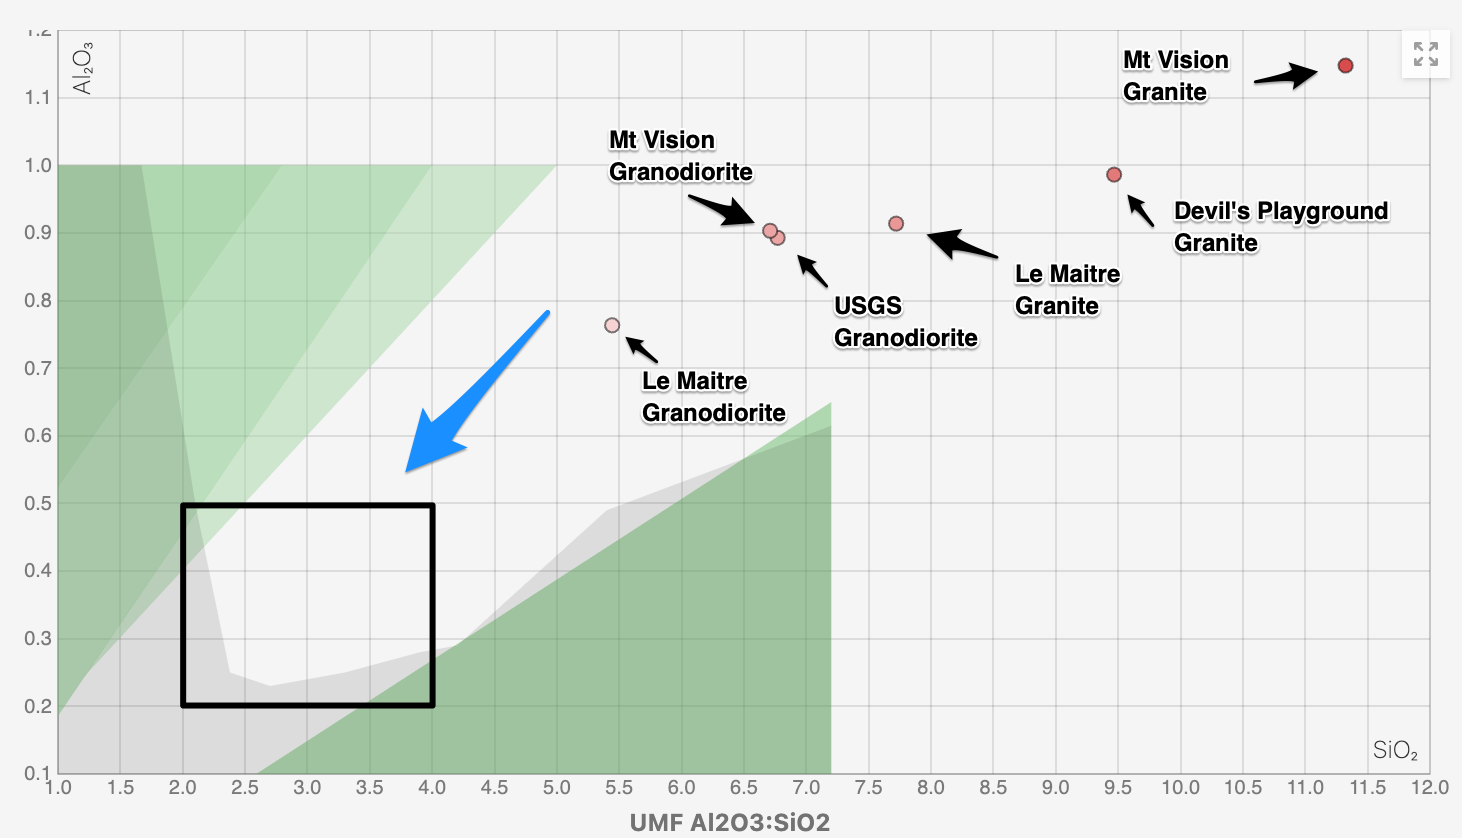
In spite of the CIWP Norm calculation mis-mapping, but consistent with the chemical analyses, the USGS reference granodiorite coincides closely to the "dark" sample granodiorite, with the Le Maitre average granodiorite mapping to the left.
All the granite examples scatter to the right of the granodiorite examples with the "light" sample granite mapping furthest right due to its high silica content and the Le Maitre average granite on the left of the granite group.
At this point we can reasonably conclude the "dark" sample is granodiorite. Given the literature is clear on granodiorite being the predominant granite on the Inverness Ridge, this is a welcome result.
The "light" sample remains a bit of a mystery. From the data it appears to be a "high-silica granite", according to the QAPF, but its silica content is far above the Le Maitre average granite. Speaking with a geologist friend of mine, his interpretation of the "light" sample is it may have formed from late-stage magmas that intruded the main rock body late in the evolution of the Mt Vision pluton. Such late-stage magmas are often found to have exceedingly high concentrations of silica.
Returning to the UMF diagram and making a glaze from the "dark" and / or "light" samples, the challenge will be to add other rock-based materials, containing fluxes, alumina and silica, in the right proportions, to adjust the silica to alumina ratios down and to the left into the black box, which is the zone where a glaze will melt in our kilns and behave in desirable ways.
Finally, regarding the "dark" and "light" samples, I am left with a bit of a quandary. Do I mix them together in my processing or not? Initially I did just this without much thought or measure. And I obtained encouraging results, but found I could not repeat them consistently, so now, after further consideration and experimentation, I have decided to separate them as best I can and treat them as different materials. As such I will refer to them as Mt. Vision Granodiorite and Mt. Vision Granite, respectively.
References
- Devil's Playground Granite / Hamish Jackson
- CIPW Norm Calculation Software by Jake Lowenstern USGS, 2000 (includes data from Le Maitre, 1976). Another nifty tool CIPW tool can be found here
- Earth Materials: Introduction to Mineralogy and Petrology, Kline and Philpotts, 2016 on Amazon, Chapter 10 (includes data from Le Maitre, 1976)
- Geology at Point Reyes National Seashore and Vicinity, California: A Guide to San Andreas Fault Zone and the Point Reyes Peninsula, USGS, Chapter 9
- Geology of the Point Reyes Peninsula, Marin County, Ca, by Alan J. Galloway, 1977
- High silica granites: Terminal porosity and crystal settling in shallow magma chambers by Cin-Ty A. Leea and Douglas M. Mortonb, Earth and Planetary Science Letters 409 (2015) 23–31
- Periodic Table - Ptable
- Port, R. B. 2018. Point Reyes National Seashore: Geologic resources inventory report. Natural Resource Report NPS/NRSS/GRD/NRR—2018/1784. National Park Service, Fort Collins, Colorado, by R.B. Port, 2018
- QAPF diagram
- Rb-Sr Whole-Rock and Mineral Ages, K-Ar, 40Ar/39Ar, and U-Pb Mineral
ages, and Strontium, Lead, Neodymium, and Oxygen Isotopic Compositions for Granitic Rocks from the Salinian Composite Terrane, California, by R. W. Kistler and D. E. Champion, Open-File Report 01-453, USGS, 2001 - The Chemical Variability of some Common Igneous Rocks, RW Le Maitre, Journal of Petrology, Volume 17, Issue 4, November 1976, Pages 589–598
- USGS Granodiorite Reference